Cluster Dashboard and Monitor
Cluster Dashboard
The Cluster Dashboard is the landing screen when connecting to Gyeeta Webserver.
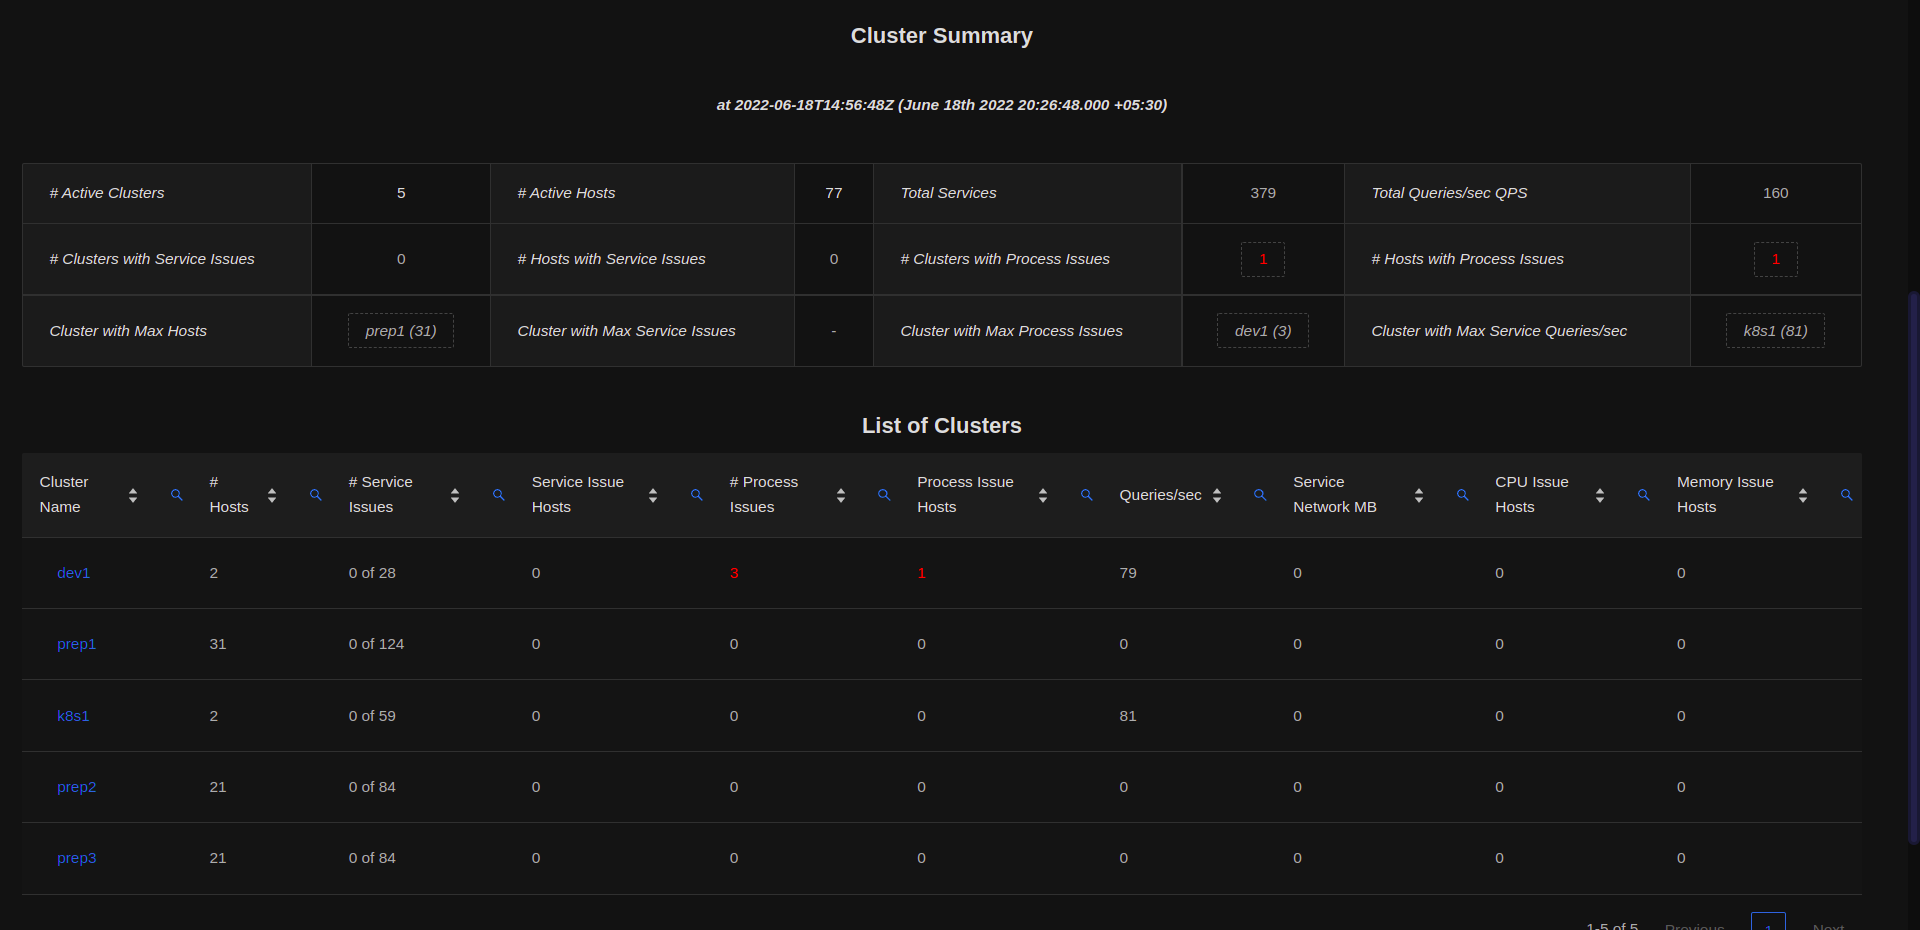
The Cluster Dashboard shows the state of all clusters active amongst all hosts. The state is marked as Bad or Severe depending on the number
of Services and Processes that are in Bad or Severe state and depending on the number of hosts having CPU or Memory issues.
This enables a quick evaluation of how all the clusters globally are performing and for any clusters with issues, further drilldown enables users to determine the processes or services or hosts of issue within that cluster.
The Cluster Dashboard is updated every 15 sec.
The backend servers update the cluster state every 5 sec. The Dashboard just shows the state every 15 sec. The cluster state can be queried using REST APIs using /v1/clusterstate route
Users can further drilldown the clusters of interest by clicking on any row of the table or by clicking the Summary links where applicable. Historical data can also be queried.
Cluster Monitor
Cluster Monitor is used to graphically monitor the state of a specific cluster either in real time or for historical time periods.
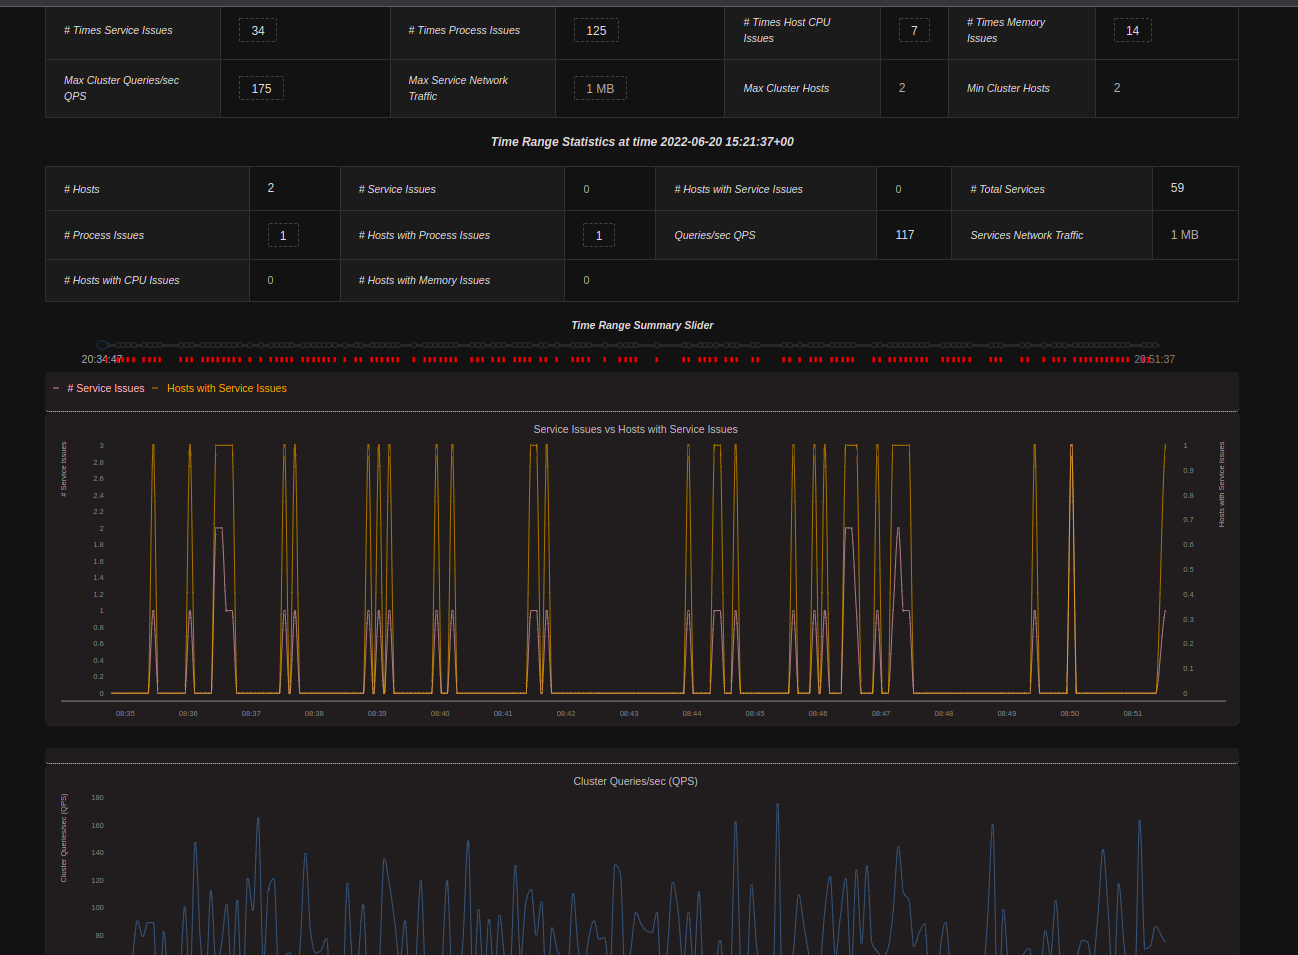
Using the cluster monitor, users can drilldown after selecting the period of interest and get the precise Service/Host/Processes which have issues. The Cluster Monitor is updated every 15 sec.