Process Dashboards and Monitors
Process Dashboard
The Process Dashboard lists out the current Top Grouped Processes in various aspects. The list of Processes displayed is as per the Dashboard type. The Global Process Dashboard shows the Top Processes across all the hosts. The Cluster Process Dashboard will show the Top Processes within the selected cluster while the Host Process Dashboard will show the Top Processes within the selected host.
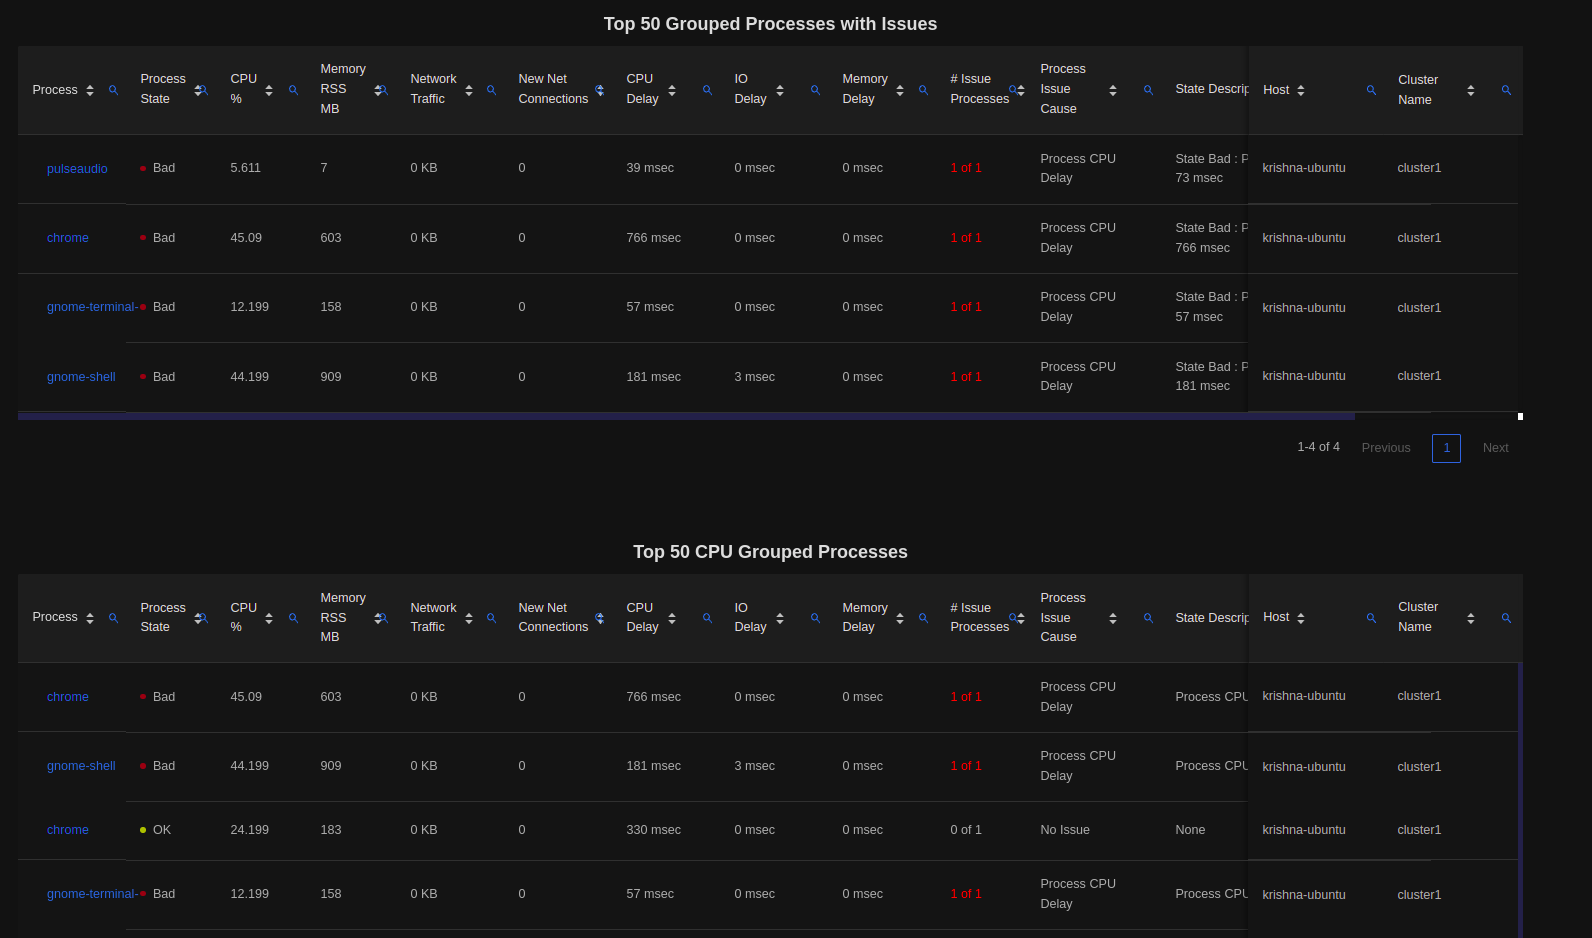
The Grouped Processes are displayed as per the following categories :
Processes with Issues (Processes States
SevereorBad)Processes with top CPU Utilization
Processes with top Memory RSS Utilization
Processes with top CPU, Memory and IO Delays
Processes with top Network Traffic
The Process Dashboard is auto-updated every 20 sec. The statistics displayed help the user to narrow down to any Process Issue or monitor the overall states.
Drilldowns are available on clicking on any Process Table Row.
Process State Monitor
The Process Monitor is used to graphically monitor the statistics of a specific Grouped Process either in real time or for historical time periods.
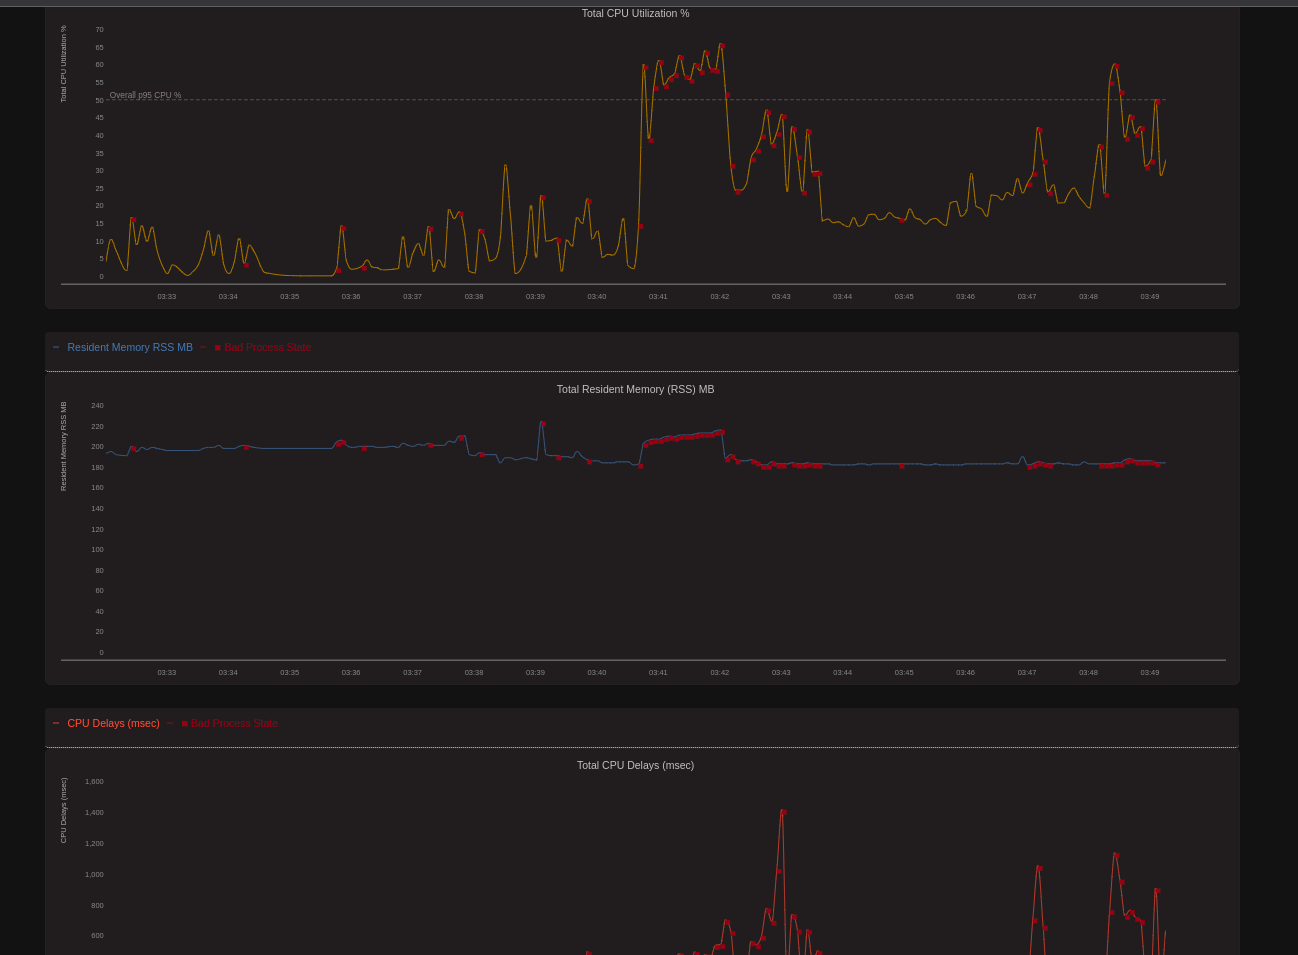
The backend servers update the Process states every 5 to 15 sec depending on the Process activity. The Process states can be queried using REST APIs using /v1/extprocstate route.
Process Network Flow Dashboard
The Process Network Flow Dashboard lists out all the currently active Network connections for the specific Groouped Process.
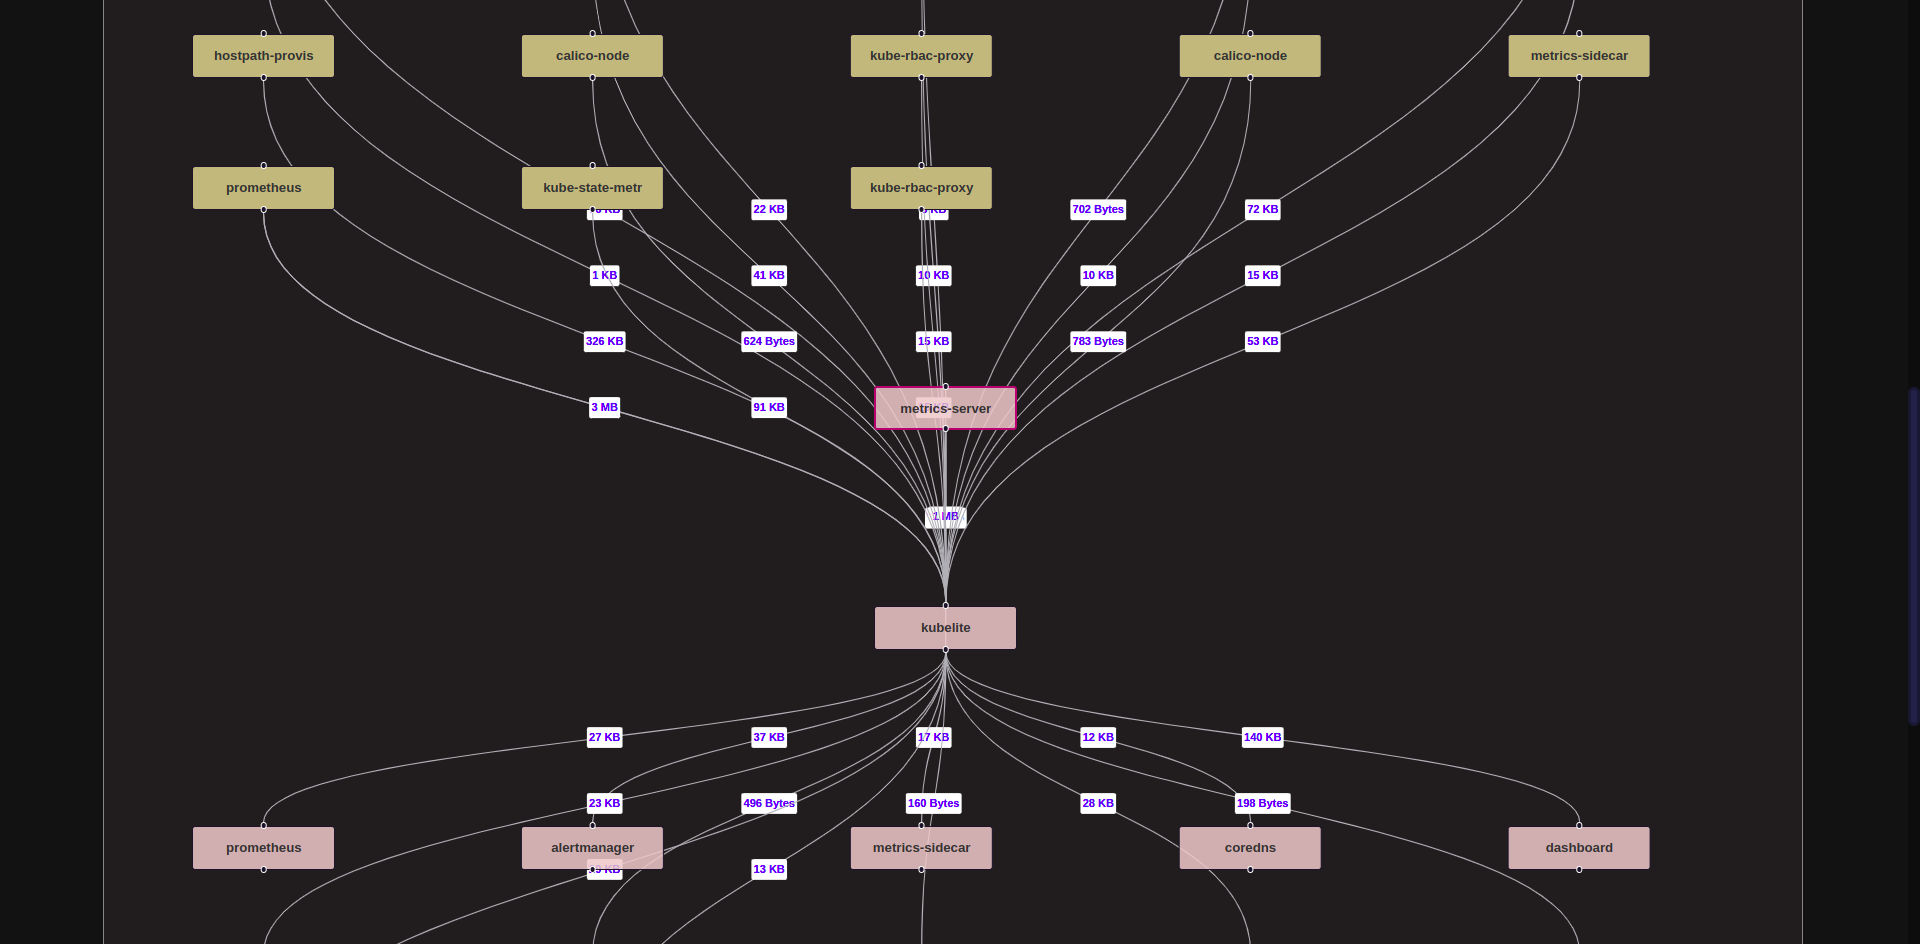
The above snapshot shows all services / processes with active connections from and to the Process selected (i.e. metrics-server in the snapshot above).