Host Dashboards and Monitors
Host Dashboard
The Host Dashboard lists out all the currently active Hosts and shows their current state and various other statistics.
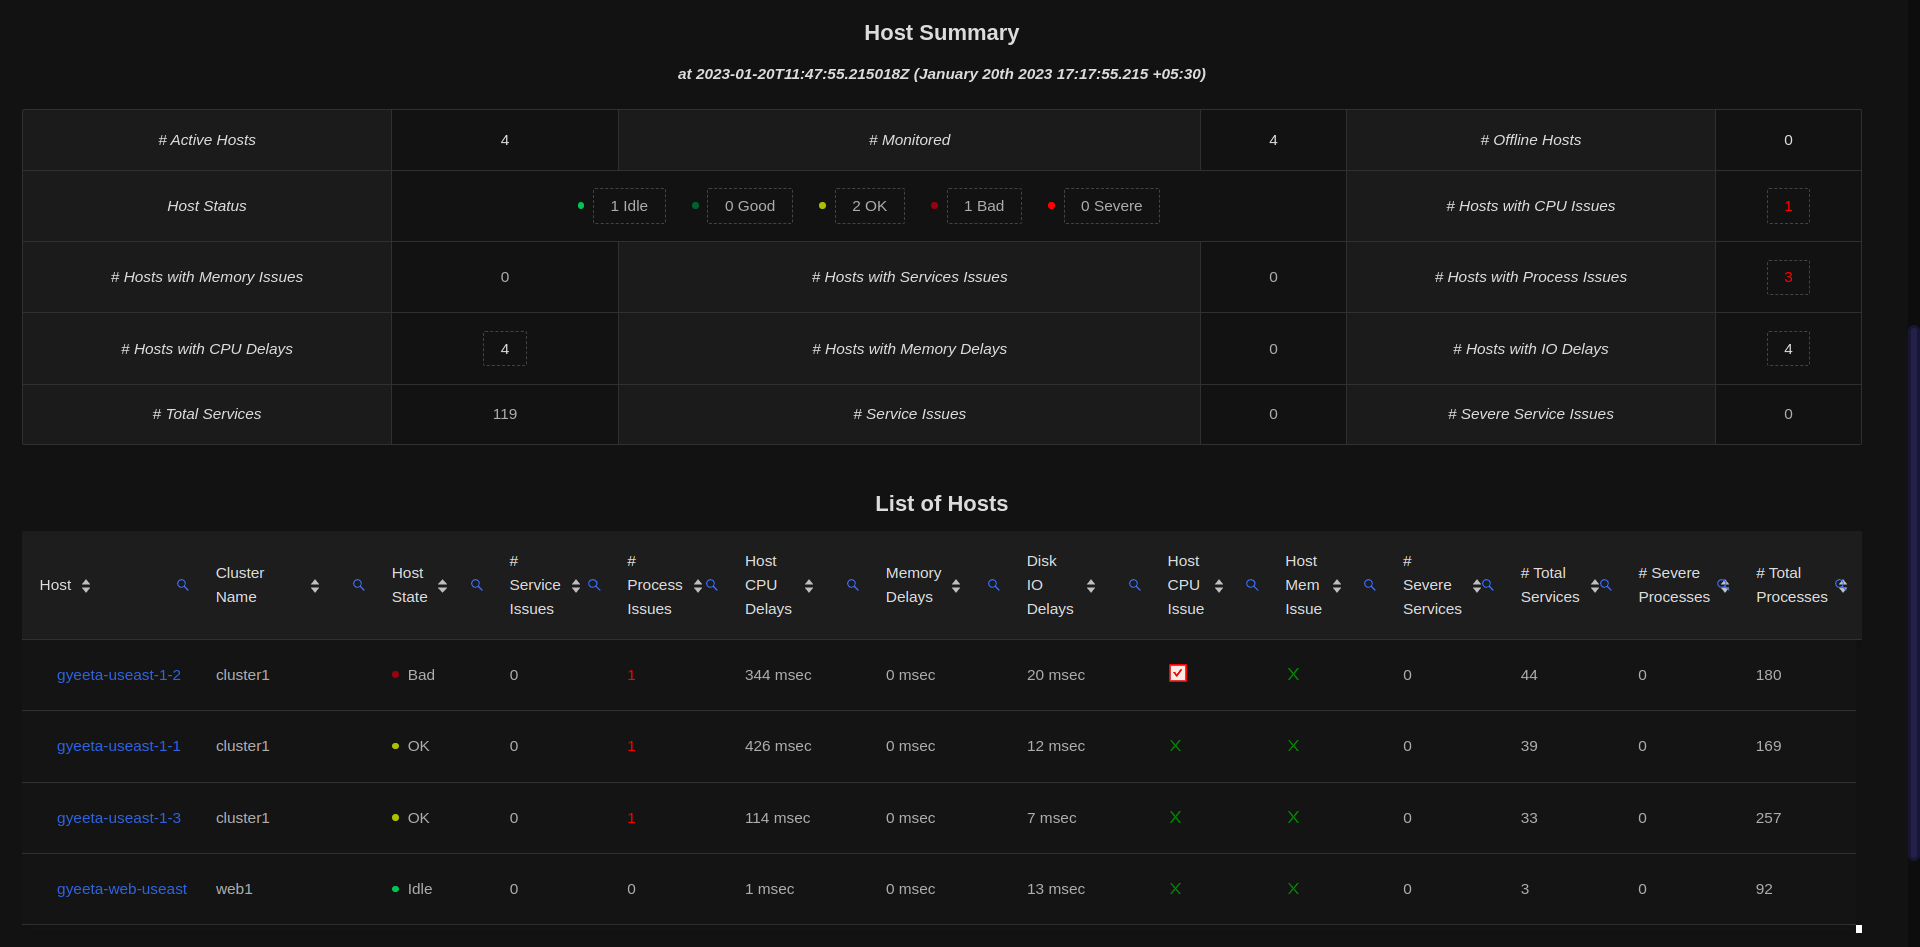
The Host state is marked as Idle, Good, OK, Bad or Severe depending on the number
of Services and Processes that are in Bad or Severe state and depending on CPU and Memory status.
This enables a quick evaluation of how all the hosts globally are performing and for any hosts with issues, further drilldown enables users to determine the processes or services of issue within that host.
The Host Dashboard also lists the Host level Contention (Delay) statistics for CPU, Memory and Disk IO. This allows a very quick way to figure out the hosts which are facing heavy CPU, Memory or IO contention or pressure.
The Host Dashboard is updated every 15 sec.
The backend servers update the Host state every 5 sec. The Dashboard just shows the state every 15 sec. The Host state can be queried using REST APIs using /v1/hoststate route.
Host State Monitor
The Host Monitor is used to graphically monitor the state of a specific Host either in real time or for historical time periods.
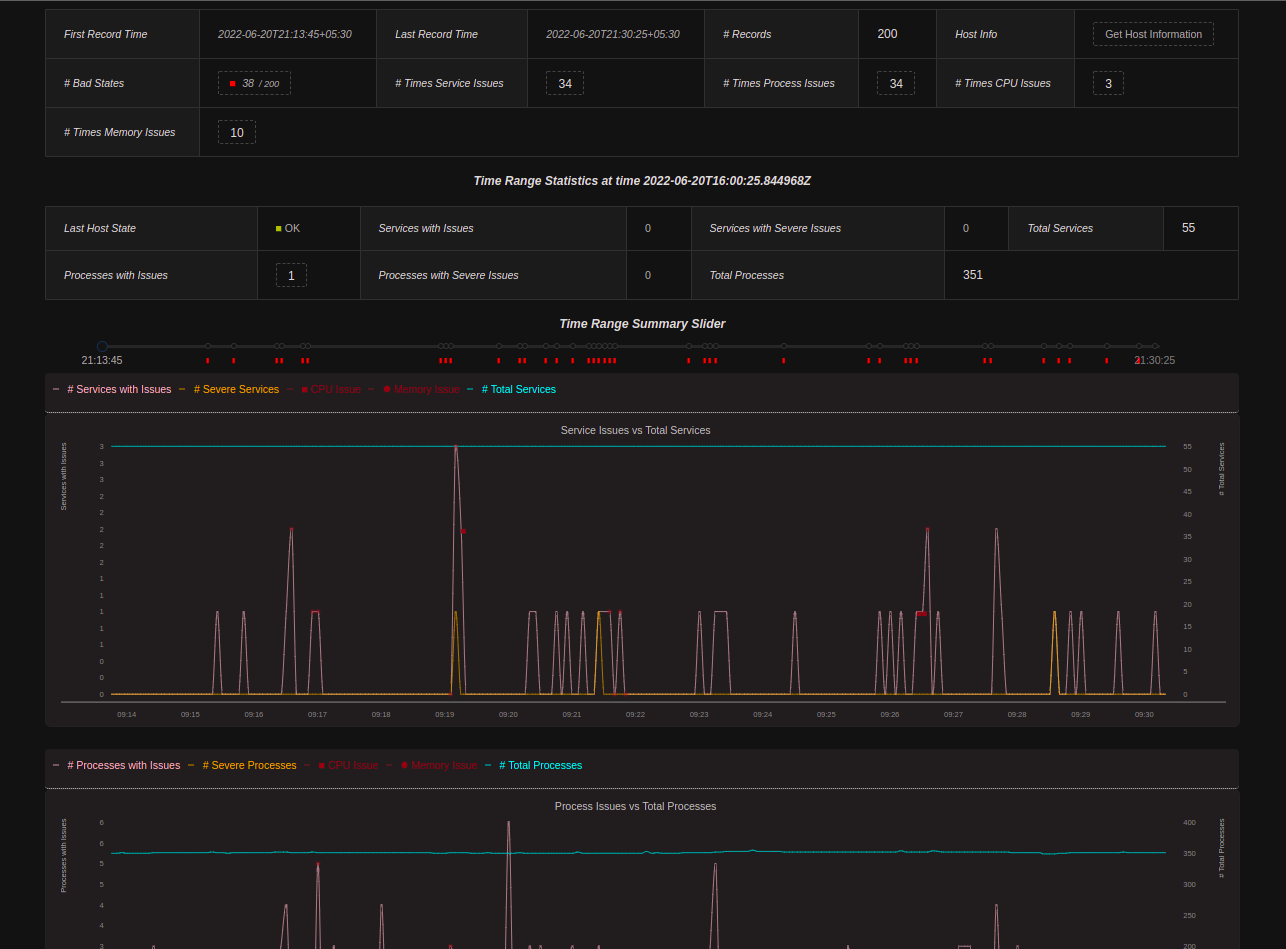
Using the Host monitor, users can drilldown charts after selecting the period of interest and get the precise Service/Processes which have issues. The Host Monitor is updated every 5 sec.
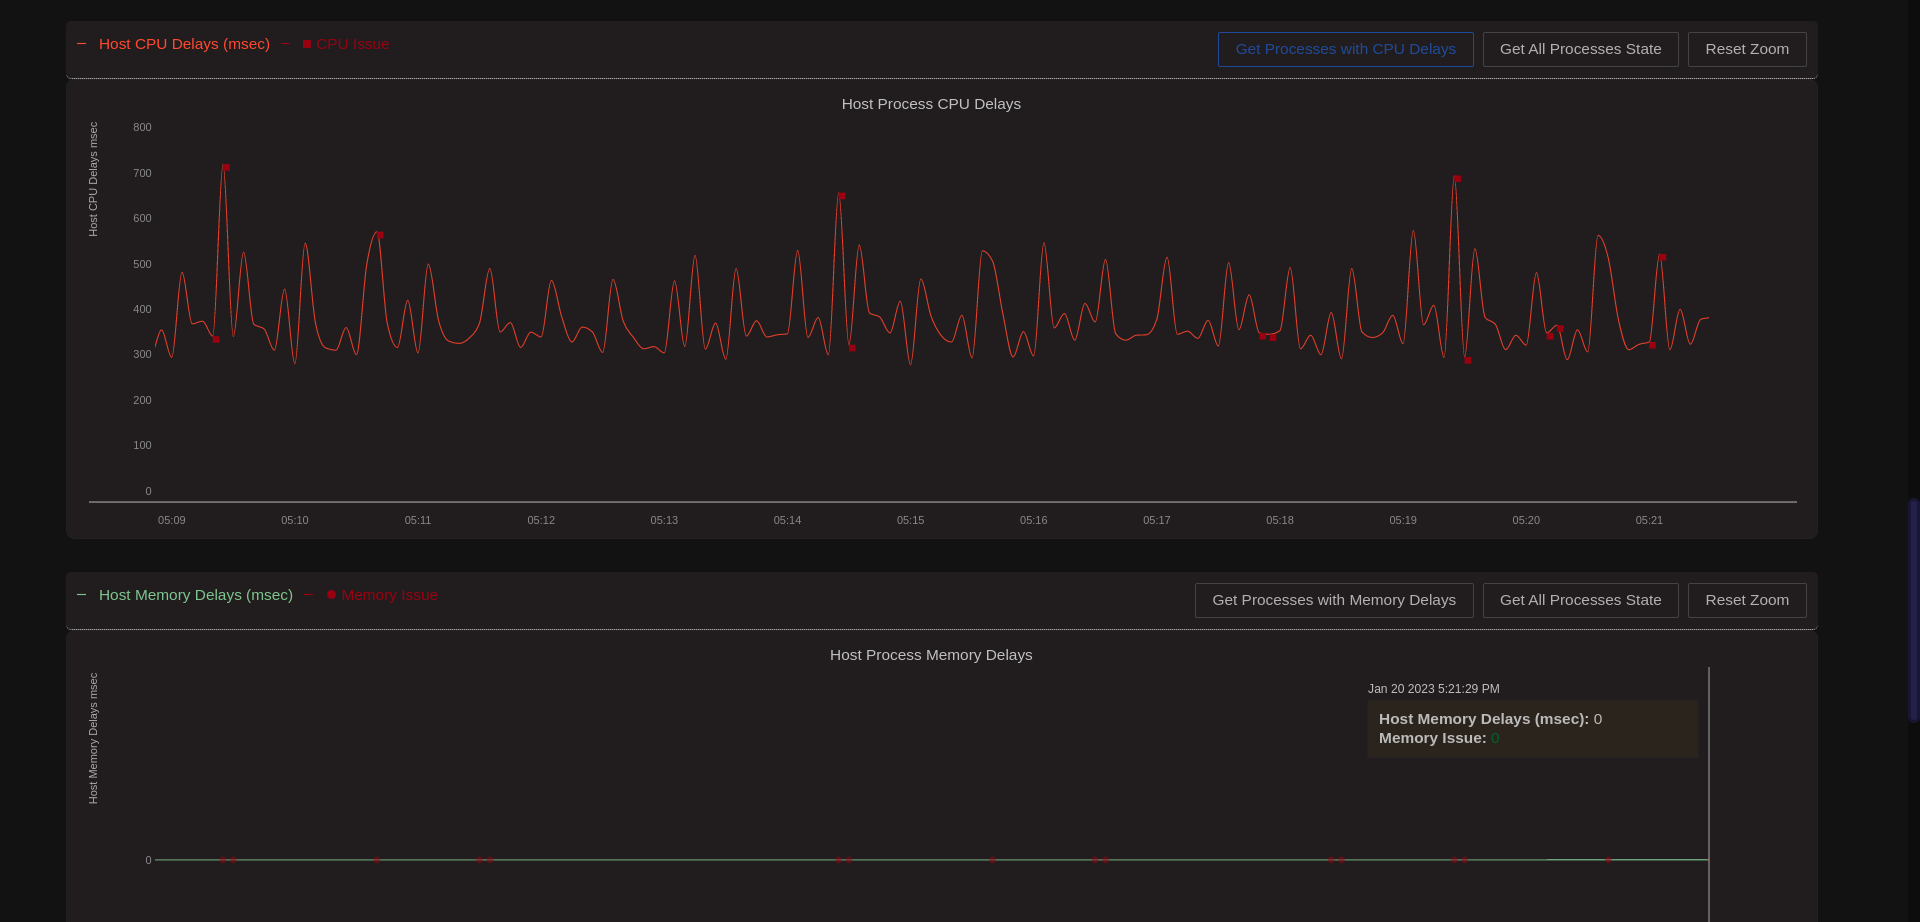
Host CPU Memory Monitor
The Host CPU Memory Monitor graphically monitors the CPU and Memory related metrics of a specific Host in real time or for historical time periods.
The Host CPU Memory Monitor is updated every 5 sec. Users can drilldown individual charts. For example if there is page swapping,
on drilldown, users can get processes on that host affected by Memory or disk IO delays, or processes that are marked Bad or Severe
due to Memory issues.
The Host CPU Memory state can be queried using REST APIs using /v1/cpumem route. The server updates the Host CPU Memory statistics every 4 sec.
Host Network Flow Dashboard
The Host Network Flow Dashboard lists out all the currently active Network connections for the specific host.
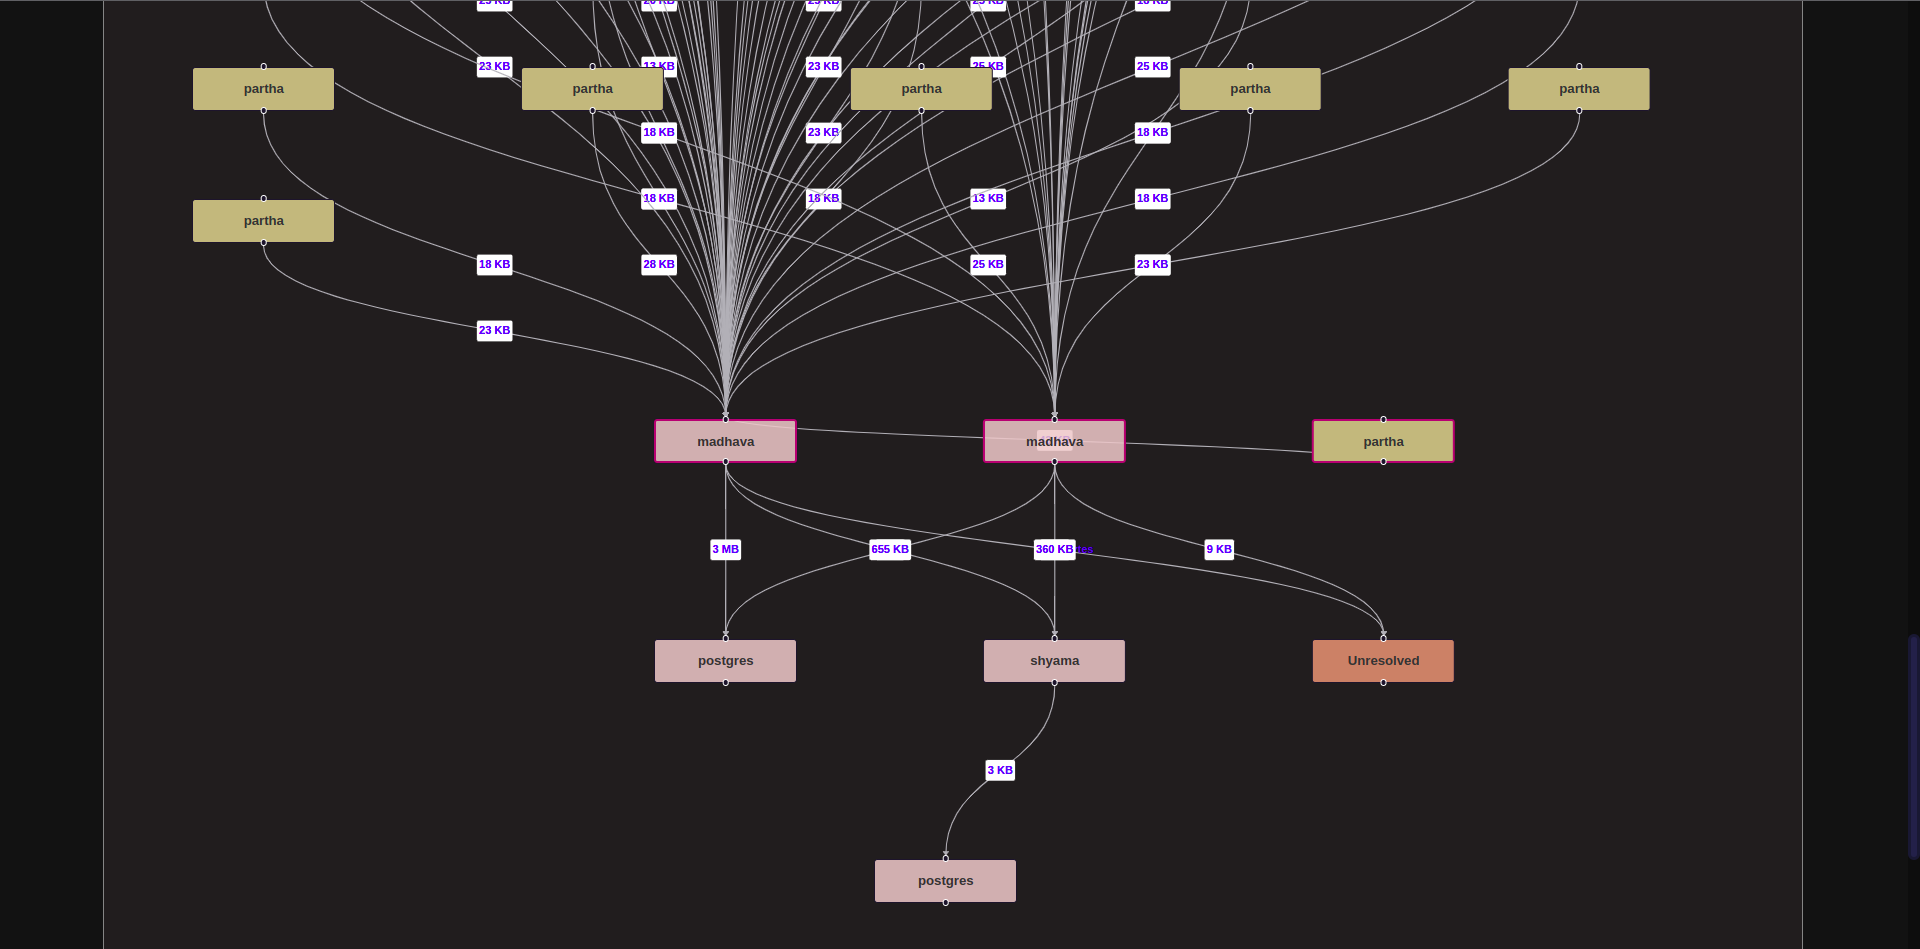
The Host Network Flow Dashboard is updated every 20 sec. It shows all services / processes of the host with currently active network connections, both within the host itself and external host connections as well. By default, all the Network Flow Dashboards show 3 tiers of connections : the central tier consisting of Services and Processes of the selected host, an upstream tier consisting of services which are called from the central tier clients and a downstream tier consisting of clients connecting to the central tier services.
Users can fetch data for further tiers by clicking on the Get Next Upstream Tier or the Get Next Downstream Tier buttons. Clicking on any of the elements shown (for all tiers) will enable drilldown for further analysis.
The backend servers update the Network Flows every 15 sec. The Flows are fetched in the UI using multiple REST API calls. The calls include /v1/extactiveconn, /v1/extclientconn and /v1/svcprocmap