Service Dashboards and Monitors
Service Dashboard
The Service Dashboard lists out the current Top Services in various aspects. The list of services displayed is as per the Dashboard type. The Global Service Dashboard shows the Top Services across all the hosts. The Cluster Service Dashboard will show the Top Services within the selected cluster while the Host Service Dashboard will show the Top Services within the selected host.
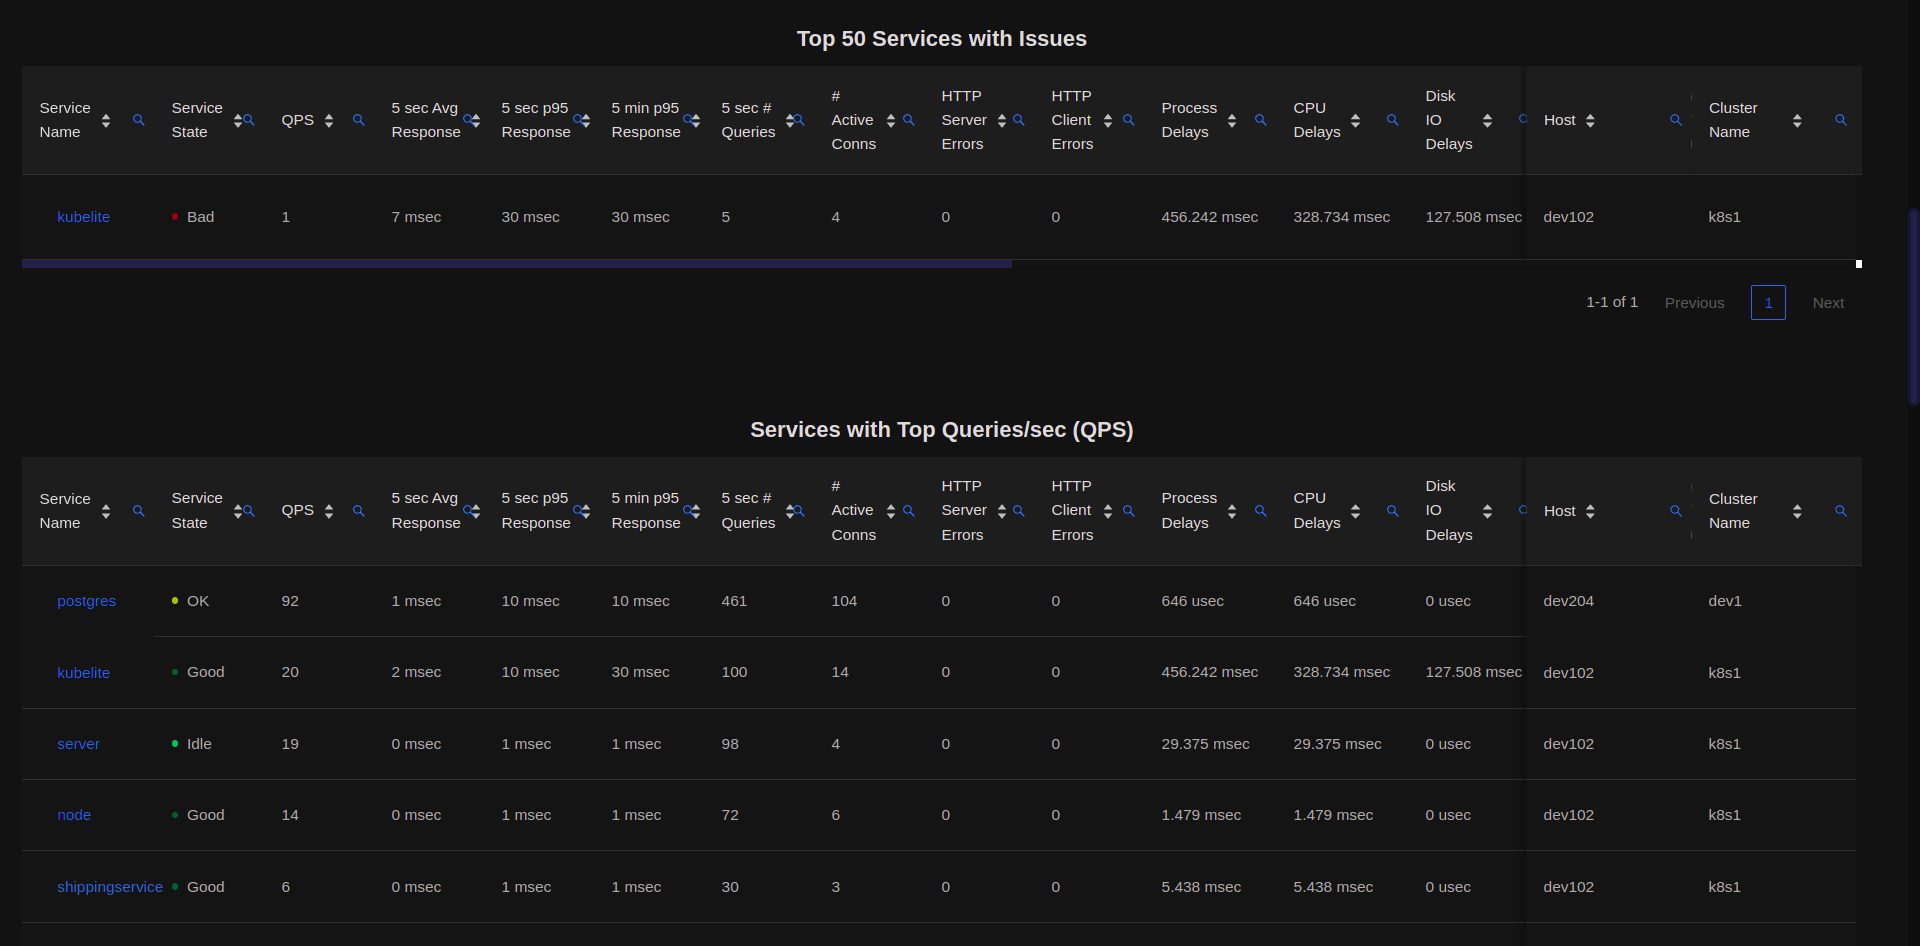
The Services are displayed as per the following categories :
Services with Most Issues (Service States
SevereorBad)Services with the Most Queries/sec (QPS)
Services with Max Active Connections
Services with Max Network In + Out Traffic
The Service Dashboard is auto-updated every 15 sec. The statistics displayed help the user to narrow down to any potential Service Issue or monitor the overall states.
Drilldowns are available on clicking on any Service Table Row.
Service State Monitor
The Service Monitor is used to graphically monitor the statistics of a specific Service either in real time or for historical time periods.
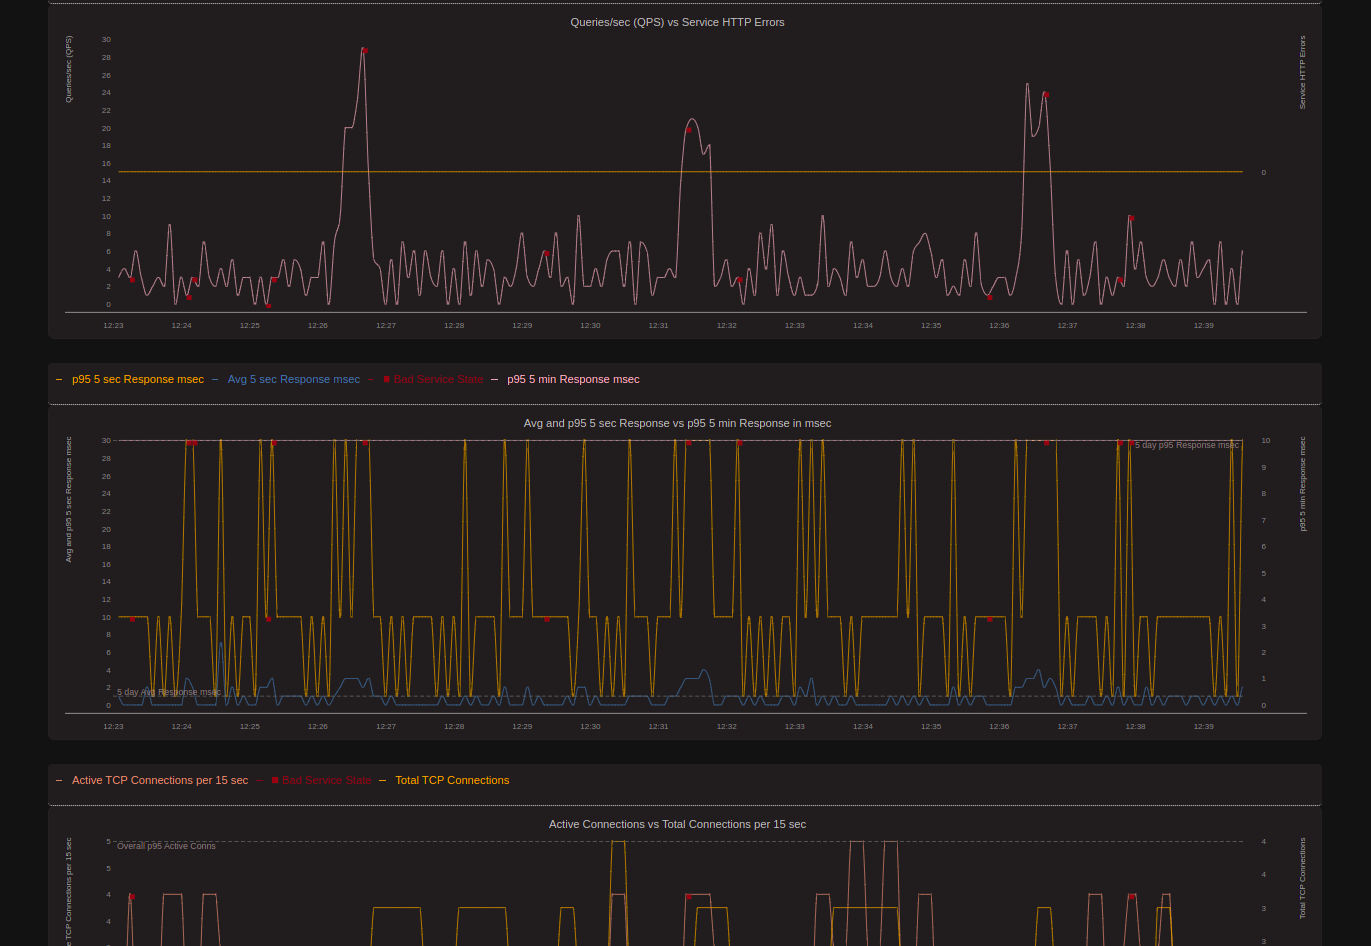
The Service State Monitor is updated every 5 sec. Users can drilldown individual charts. For example if there is a large QPS spike, on drilldown, users can get the Network Flows for that service during the spike, to check the clients connecting and which clients had the most Network Traffic.
The backend servers update the Service states every 5 sec. The Service states can be queried using REST APIs using /v1/extsvcstate route.
Service Network Flow Dashboard
The Service Network Flow Dashboard lists out all the currently active Network connections for the specific service.
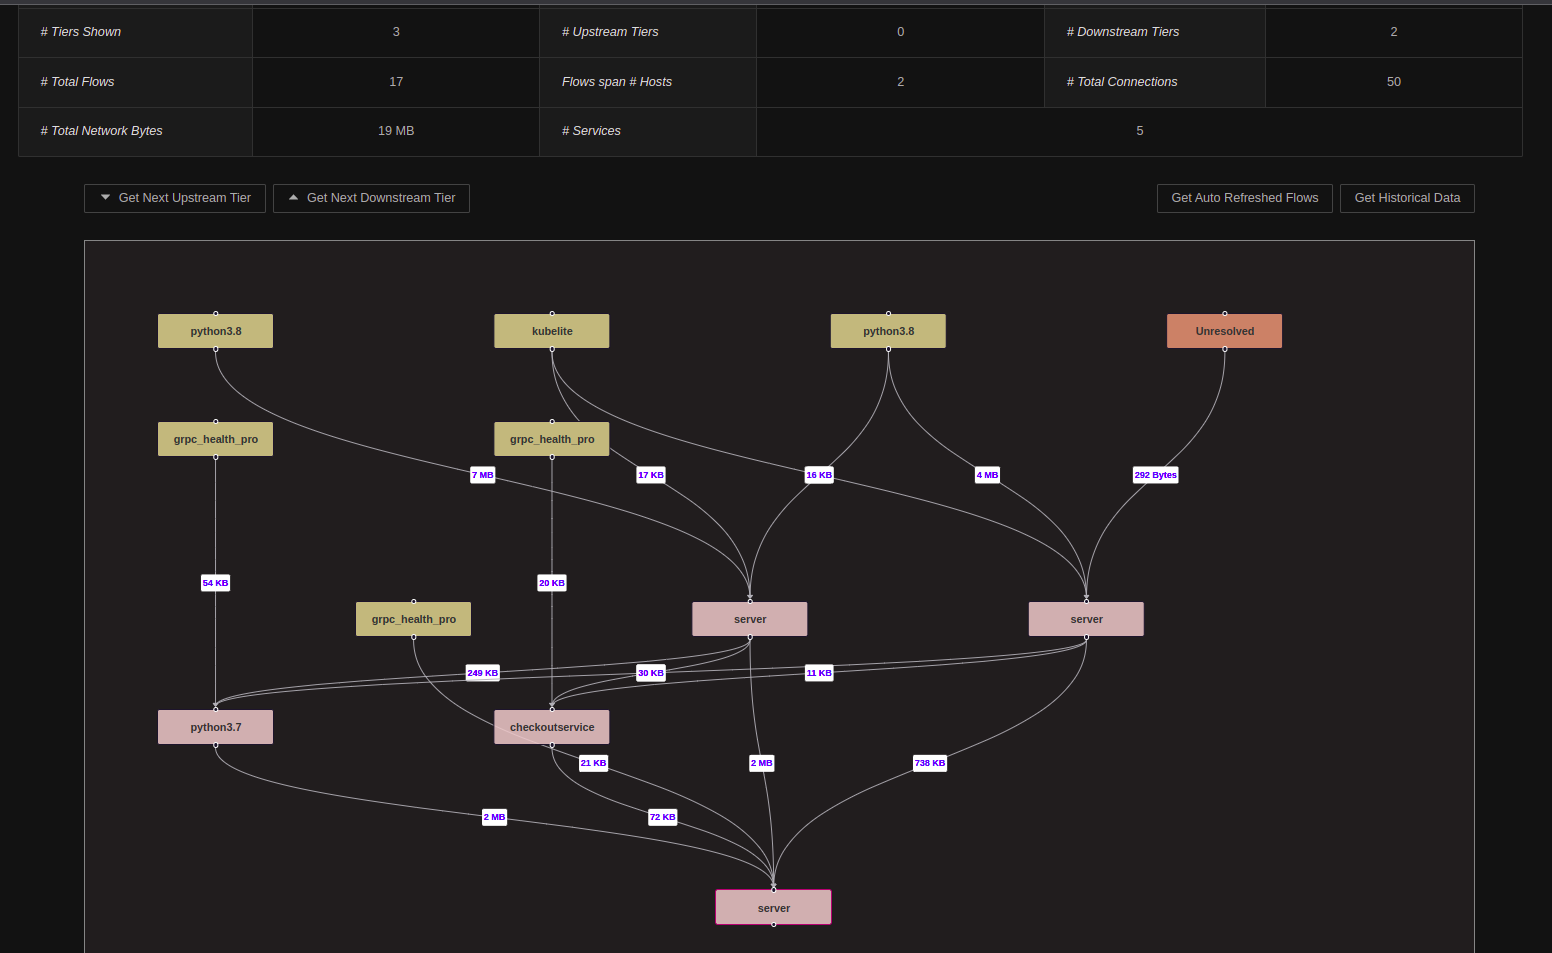
The above snapshot shows all services / processes with active connections to the Service selected (i.e. server in the snapshot above).
The connections can be both from the host itself or external host connections as well. By default, all the Network Flow Dashboards show 3 tiers
of connections : the central tier consisting of the Selected Service, an upstream tier consisting of services which
are called from the Selected Service and a downstream tier consisting of clients connecting to the Seleceted Service.
Users can fetch data for further tiers by clicking on the Get Next Upstream Tier or the Get Next Downstream Tier buttons. Clicking on any of the elements shown (for all tiers) will enable drilldown for further analysis.
For the upstream services and downstream clients shown in the Network Flows, only connections from the selected service or connections to the selected service are shown in the Network Flows. This implies that only a subset of connections would be shown for the upstream or downstream entities.
Service Groups Dashboard
The Service Groups Dashboard lists out all the services which Gyeeta assumes are related and form a Clustered Service. The Clustered Services
may be related as a ReplicaSet in Kubernetes. Please refer to Service Groups for more details.
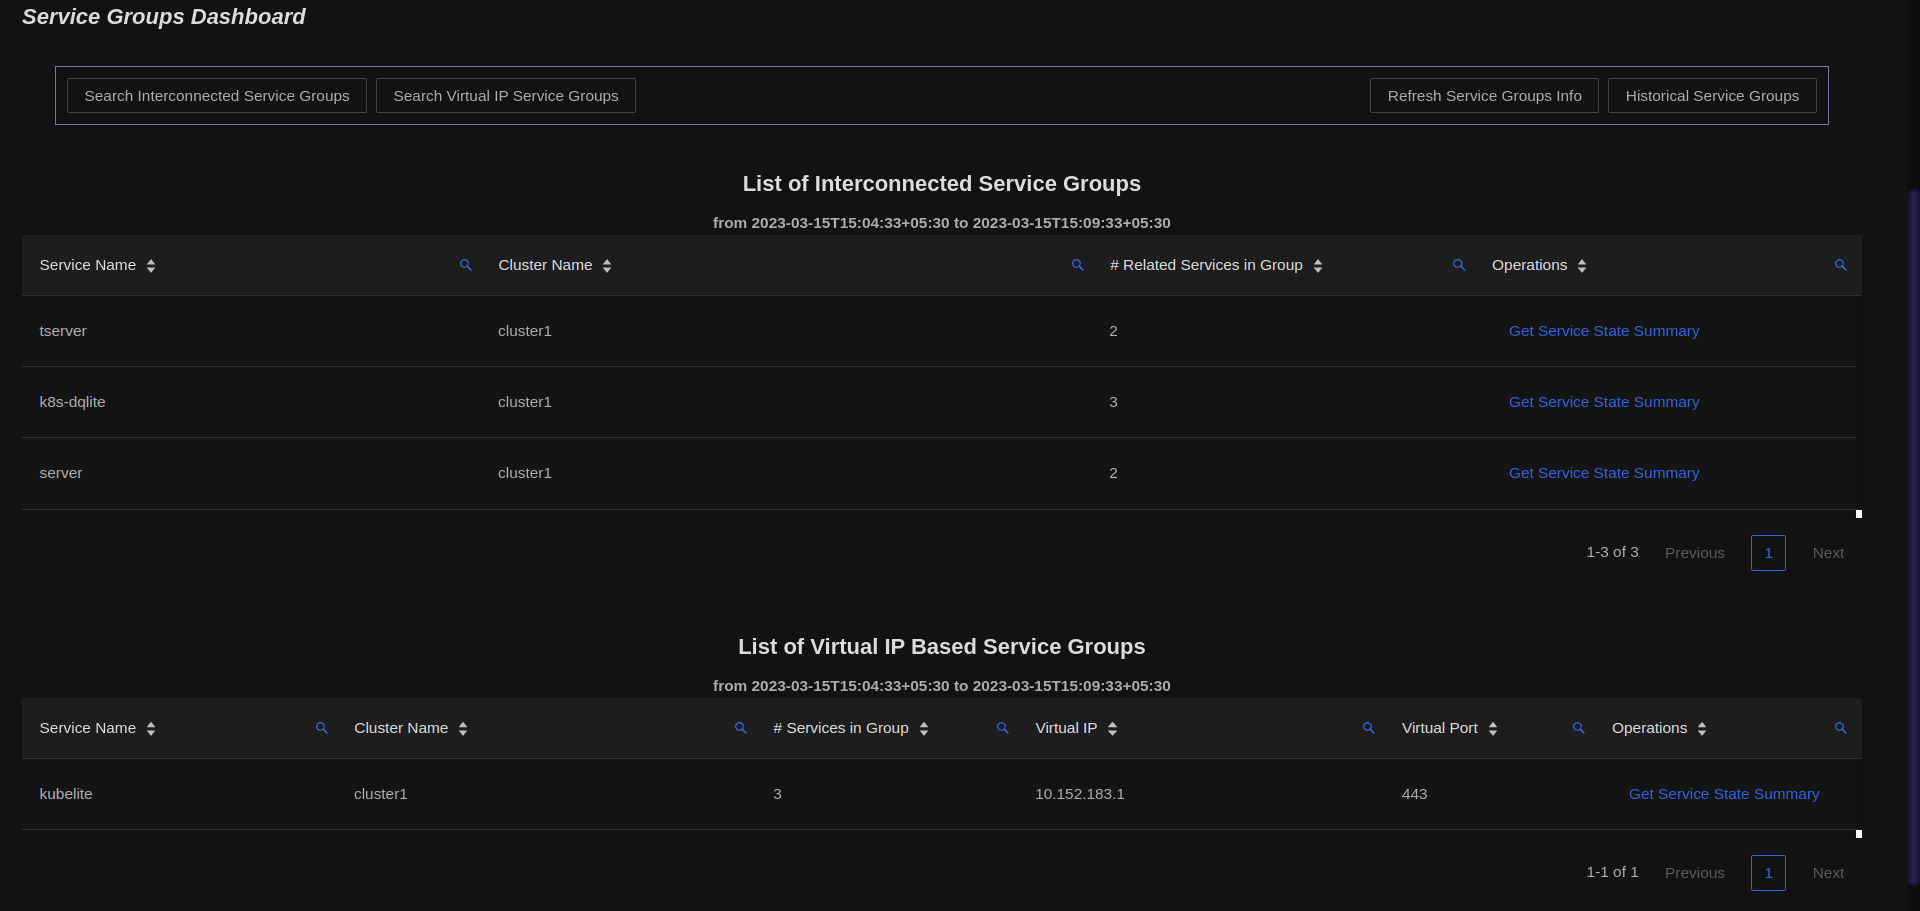
Gyeeta auto detects Service Groups based on 2 categories :
- Interconnected Services
- Virtual IP/Port based Services
Interconnected Service Groups
Services within the same cluster and with the same name or related services which interconnect with each other in a mesh network are classified by Gyeeta
as Interconnected Service Groups. Gyeeta assumes these services interact with each other in a stateful manner and can track their performance as a Clustered Group.
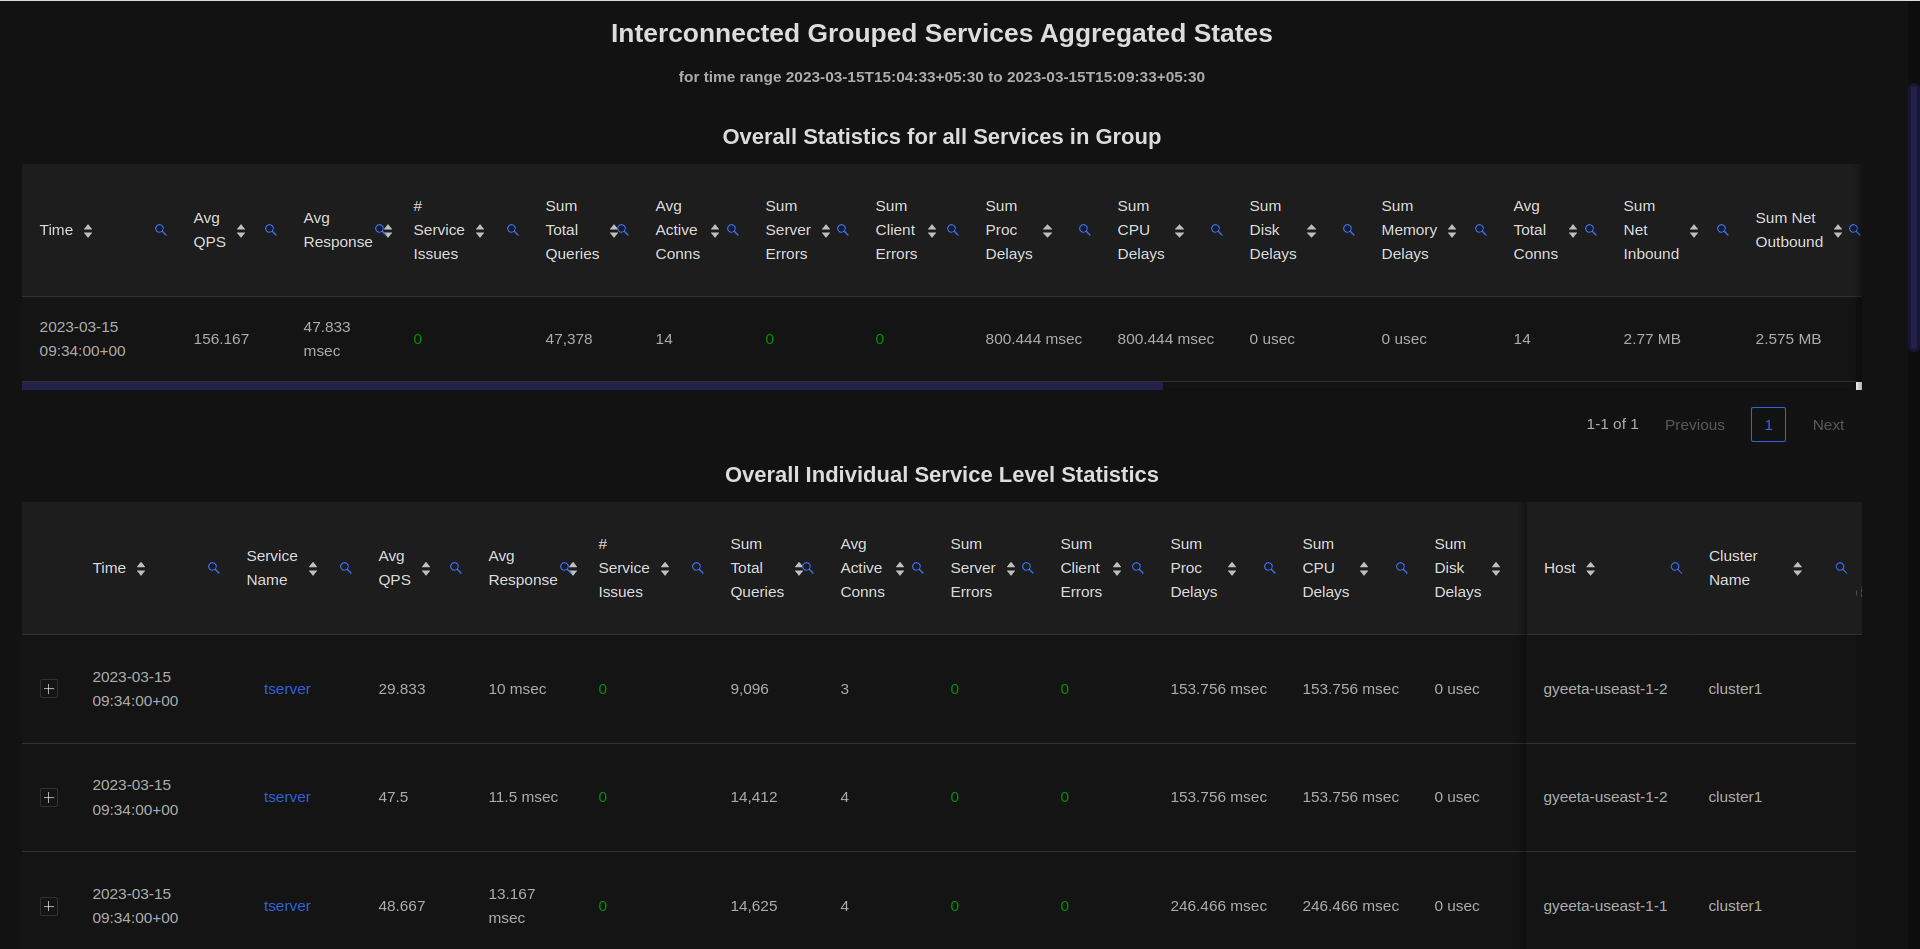
Referring to the snapshot of the Service Group dashboard shown above, clicking on the Get Service State Summary link, users can get the breakups of the individual Service Statistics as well as Cumulative Statistics across all instances within that Service Group as shown below :
Virtual IP Based Service Groups
Services within the same cluster and with the same Virtual IP and Port are classified by Gyeeta as being in a
Virtual IP Based Service Group. This is analogous to Kubernetes Service IP endpoints. Only services with 2 or more instances having same
Virtual IP/Ports and within same cluster will be classified as a Service Group.
Users can get Cumulative Statistics across all services within the Service Group as well as individual Service level statistics.
Gyeeta does not communicate with Cluster Orchestrators such as Kubernetes directly. This creates an issue as Clustered Services such as a ReplicaSet may
be missed. Future releases of Gyeeta may have an optional component which will verify the Deployment Groups.